As humans, we are all prone to unintentional and sometimes irrational behavior. And that’s not always a bad thing. A spontaneous purchase of a sweet treat might trigger a dopamine surge the moment you buy it. Then, when you eat it, you get a second dopamine hit — twice the dopamine for the price of one! However, when such unconscious behavior becomes systematic, problems can arise. Perfection in action is achieved when what was once a struggle becomes unconscious and effortless — except when it comes to investing and trading.
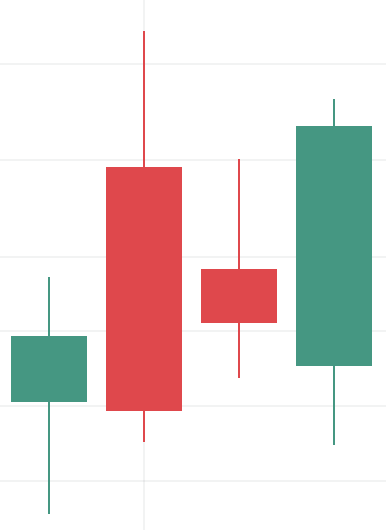
For centuries, traders have observed abnormal price movements. In the search for a way to identify such anomalies, Munehisa Honma, the wealthiest person in 18th-century Japan, developed the candlestick chart pattern — a highly informative tool not only for tracking rice futures prices, but also for gauging market participants’ mood. Honma also wrote the first-ever book on market psychology: The Fountain of Gold — The Three Monkey Record of Money, which, alongside Adam Smith’s works, later became the foundation of behavioral economics.
Market sentiment is not an isolated phenomenon — it’s a composite of the selling and buying actions of all participants, including companies, funds, and individual investors. Each has their own set of beliefs, knowledge, and practices to achieve their goals. To stay informed about market attitudes, there are various methods with similar approaches, whether you rely on technical or fundamental analysis.
Post Contents
Candlestick chart as an indicator of emotional conditions
By tracking prices, Honma realized that it is essential to consider not only external factors like weather, which could cause a rice shortage or surplus, but also traders’ state of mind when buying or selling.

As you can see, each candlestick consists of a full “body” and thin “shadows,” also known as “wicks.” Even today, many Japanese chartists consider these wicks irrelevant, focusing instead on the “body,” which depicts the true price of an asset. Steve Nison, who introduced the Western world to candlestick charts in the 1990s, also advises ignoring these “shadows” (price extremes) when identifying candlestick chart patterns or drawing trend lines.
The Fear & Greed Index: emotions quantified
Warren Buffett, one of the most successful investors of all time, said in the 1980s that he’s attempting “to be fearful when others are greedy and to be greedy only when others are fearful.”
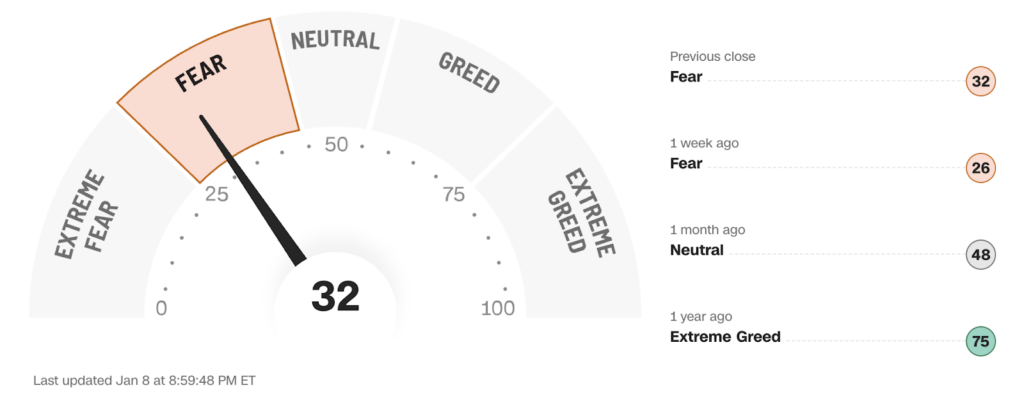
For those who use fundamental analysis, the Fear & Greed Index (FGI) is a helpful tool. Various FGIs exist, some designed for the stock market and others for crypto. Each calculates a score ranging from 0 (extreme fear) to 100 (extreme greed), with 50 being neutral.

CNN’s Fear & Greed Index
The original Fear & Greed Index, introduced by CNN Business in 2012 for the stock market, uses seven indicators (both technical and fundamental), each contributing equally to the final score.
The crypto community has also developed Fear & Greed Indexes tailored specifically to the crypto market. Like their stock market counterparts, these indexes incorporate different metrics, such as social media activity, including posts and mentions, into their calculations.
Over the past decade, the Fear & Greed Index has proven to be a reliable indicator of market sentiment, helping traders assess the community’s current mood, identify potential price deviations, and anticipate possible trend reversals.
Historical insights from the Fear & Greed Index
In November 2021, ETH price reached its all-time high of $4,700. During October 2021, one of the crypto FGIs consistently indicated “extreme greed,” with scores as high as 84. By June 2022, after a severe correction, ETH was hovering around $1,000, and the same FGI fluctuated between 6 and 17 — its lowest-ever readings.
The highest recorded FGI score was 95, observed in June 2019 and December 2020. In November 2024, two weeks before Bitcoin hit $100,000, the FGI touched 93. Since then, the Index has steadily declined. Currently, it remains in the “extreme greed” zone, hovering slightly above 70.
The bottom line
When it comes to trading and investing decisions, emotions often lead to failures and, only rarely, to significant gains. While the mental state of an individual can be unpredictable, the overall market outlook appears to be calculable, at least to some extent.
* Never rely on a single tool for trading or investing decisions. No single source of information is entirely reliable. Always follow your trading strategy and verify data multiple times.